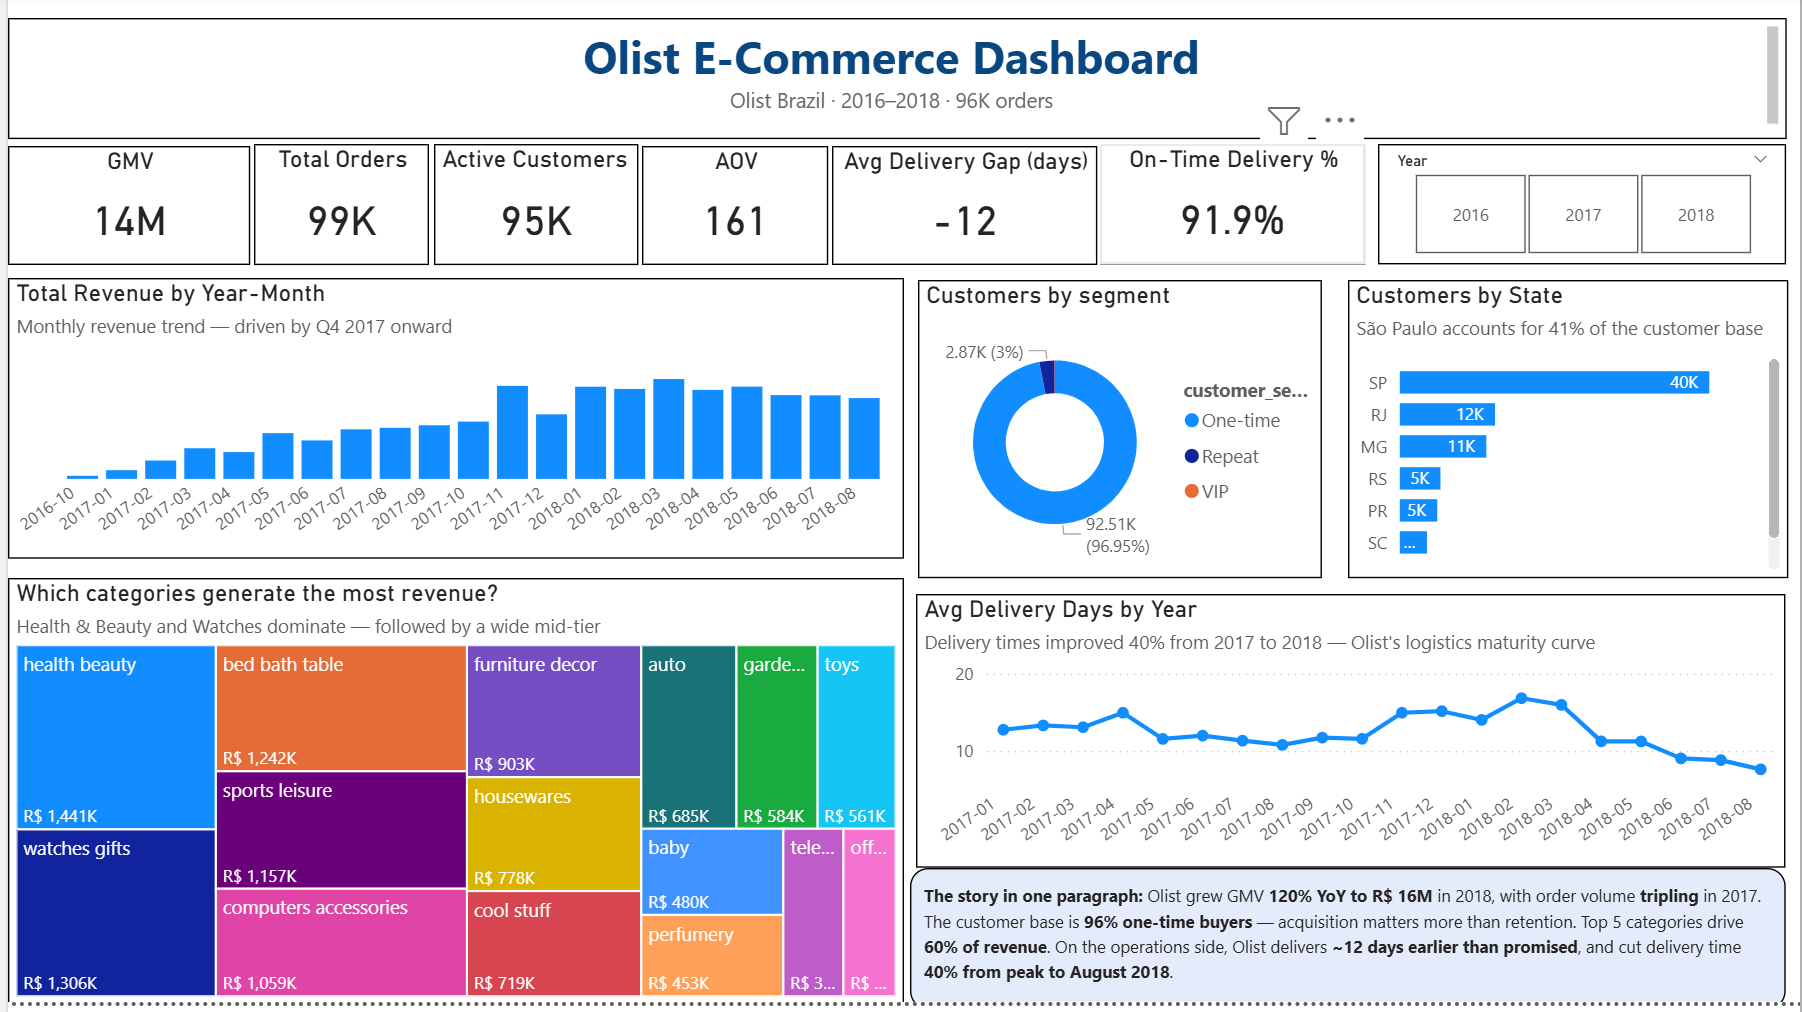
End-to-end analytics on Olist's 96K real Brazilian e-commerce orders (2016–2018). Built a Medallion data pipeline in Databricks using PySpark and SQL (Bronze → Silver → Silver Enriched → Gold), orchestrated as a Databricks Workflow DAG that runs the full pipeline in ~9 minutes. Modeled 5 Gold KPI tables and built a Power BI dashboard covering revenue, delivery performance, product categories, and customer retention. Key business insight: Olist grew 120% YoY to R$ 14M GMV, but 96% of customers buy only once — an acquisition engine without a retention strategy.

End-to-end data pipeline integrating CRM and ERP datasets into a unified analytics model. Built in Databricks using a Medallion architecture (Bronze → Silver → Gold) with PySpark transformations and Delta Lake. The Gold layer is structured as a star schema for reporting, supporting cross-functional KPI tracking across sales, customer, and product dimensions. Fully automated execution and version-controlled on GitHub.

A data-driven project using SQL for data cleaning, EDA for insights, and Power BI for dashboarding. This analysis explores traffic crashes across NYC to identify high-risk locations, top contributing factors, and vulnerable road users. Designed to inform safety initiatives by the NYC Department of Transportation.

This dataset provides information on tech industry layoffs from 2020-2022, including company names, industries, locations, and funding.

Explored global layoffs during COVID-19 using SQL to identify trends by industry, country, and company with analytical queries

This project explores and visualizes Airbnb listings in Seattle using interactive Tableau dashboards.

This project analyzes bike sales data using Excel to understand purchasing behavior based on Income levels, commuting distance, and age groups.

This project demonstrates how to clean a real-world customer call list dataset using pandas. The goal is to make the data usable for analysis by removing noise, fixing formatting issues, and eliminating duplicates or invalid entries.

This project performs exploratory data analysis on world population data. It includes visualizations and statistical insights that help understand global and regional population trends.

This project explores the relationships between a movie’s budget, gross earnings, and other features to identify which factors are most correlated with financial success.
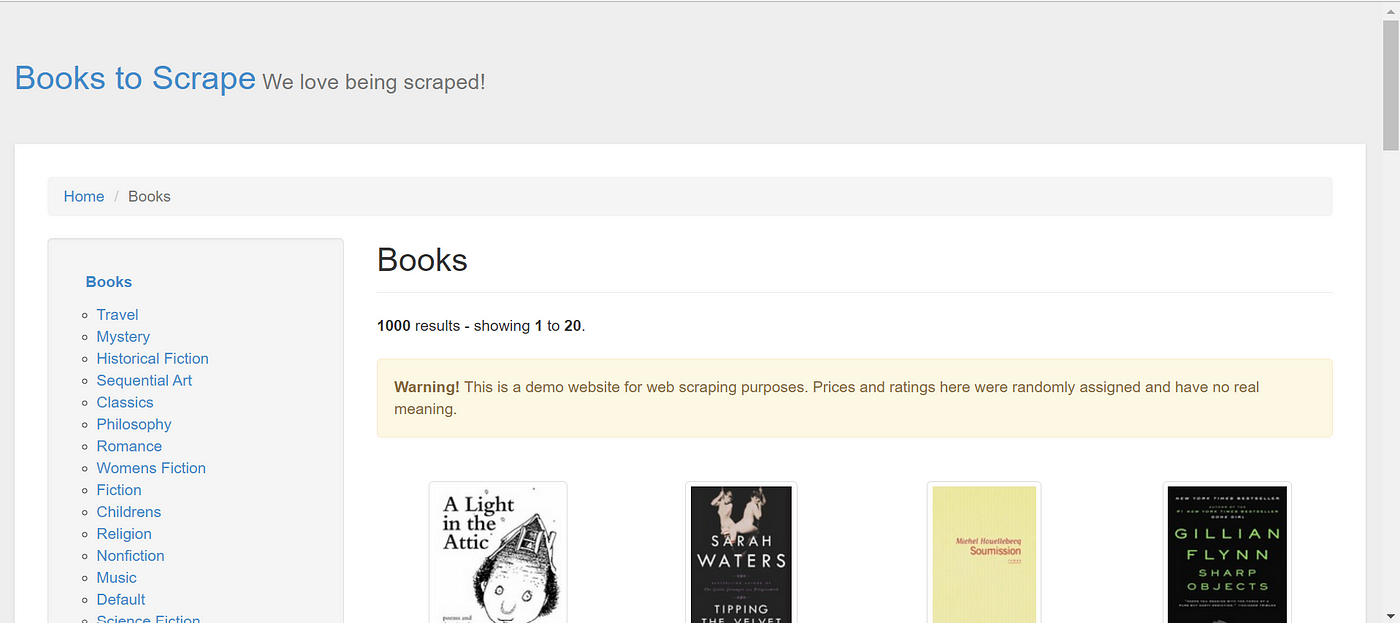
This project demonstrates how to scrape book data from a website using BeautifulSoup and requests. The scraped data includes book titles, prices, and ratings, and is saved into a structured DataFrame for future analysis.

This project explores the Palmer Penguins dataset to investigate morphological differences across species and predict the sex of penguins using various statistical and machine learning techniques. It demonstrates an end-to-end data science workflow in RStudio— from data cleaning to statistical modeling and evaluation.

The aim of this project is to analyze the effects of treatment and passage on cell growth, using a dataset from a controlled biological experiment.

This Project aimed to predict whether a mushroom is edible or poisonous based on physical features.
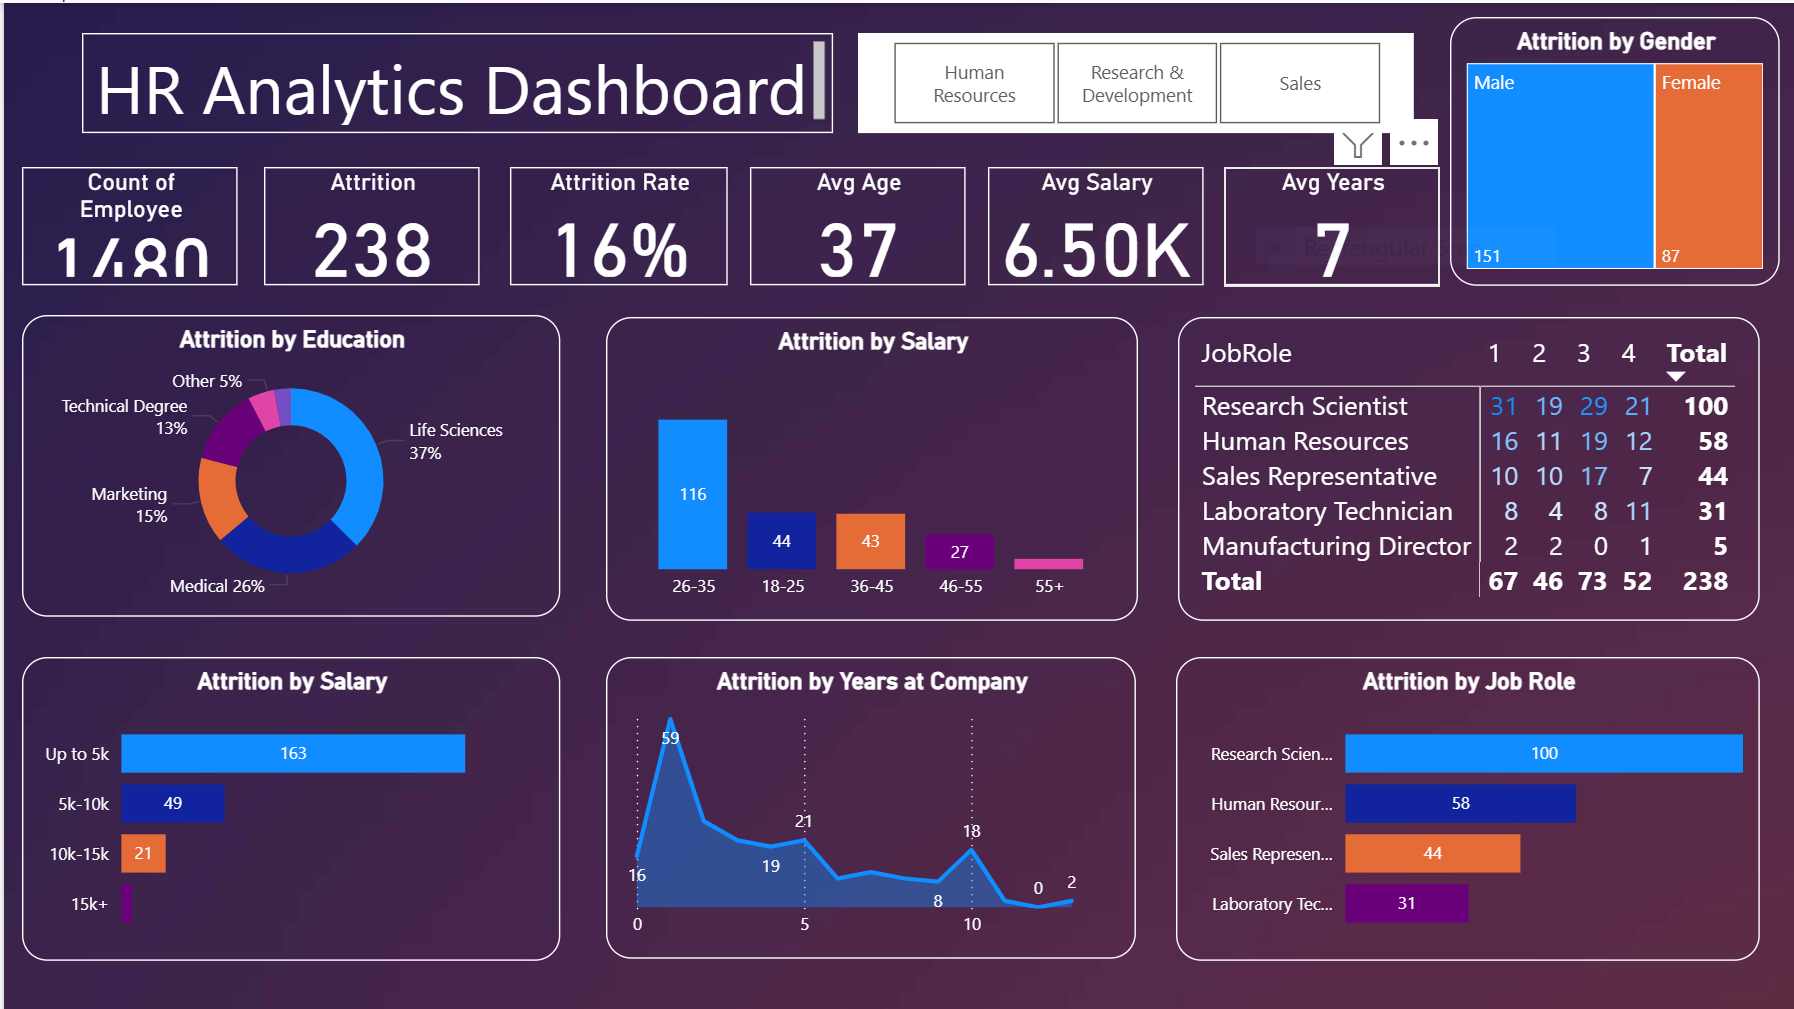
Screenshot of HR Analytics Dashboard showing employee attrition insights by gender, salary, and job role. An interactive Power BI dashboard analyzing employee attrition trends. Highlights attrition patterns across departments, roles, and demographics to support HR retention strategies.